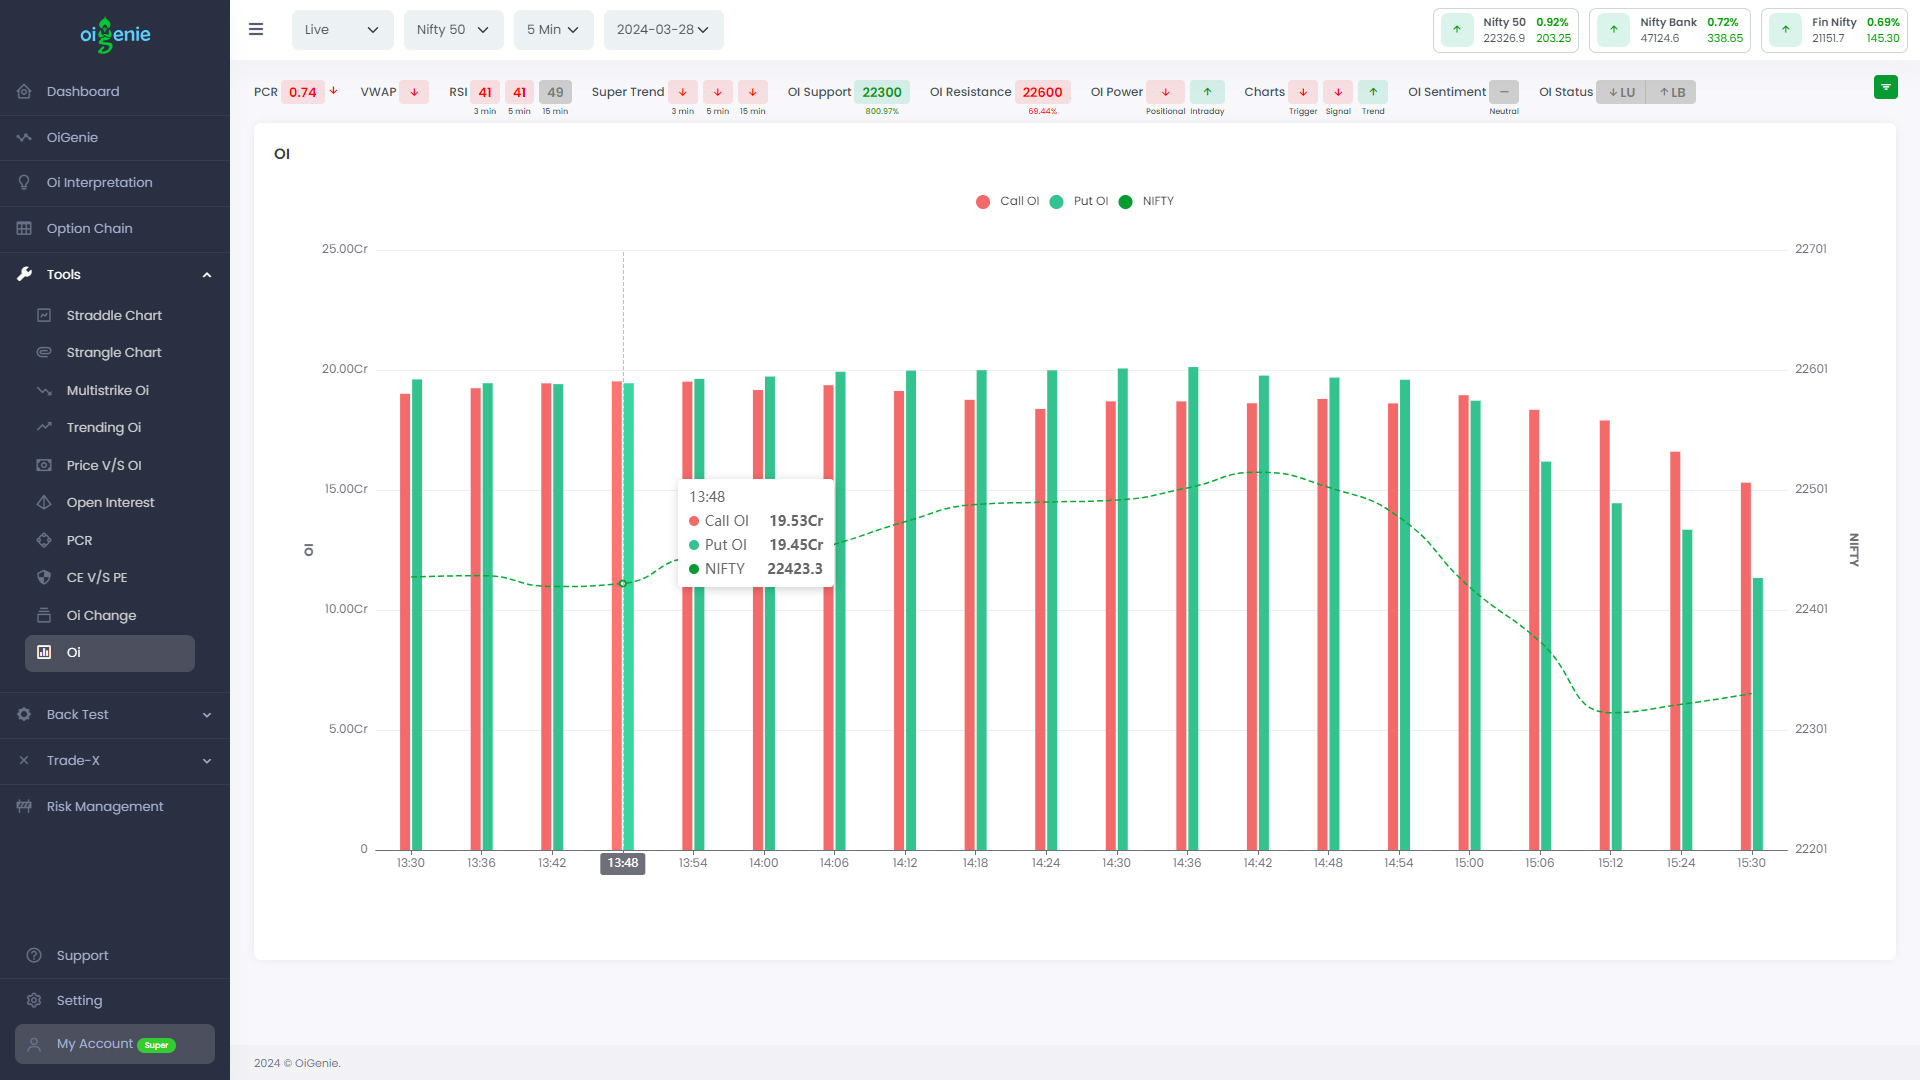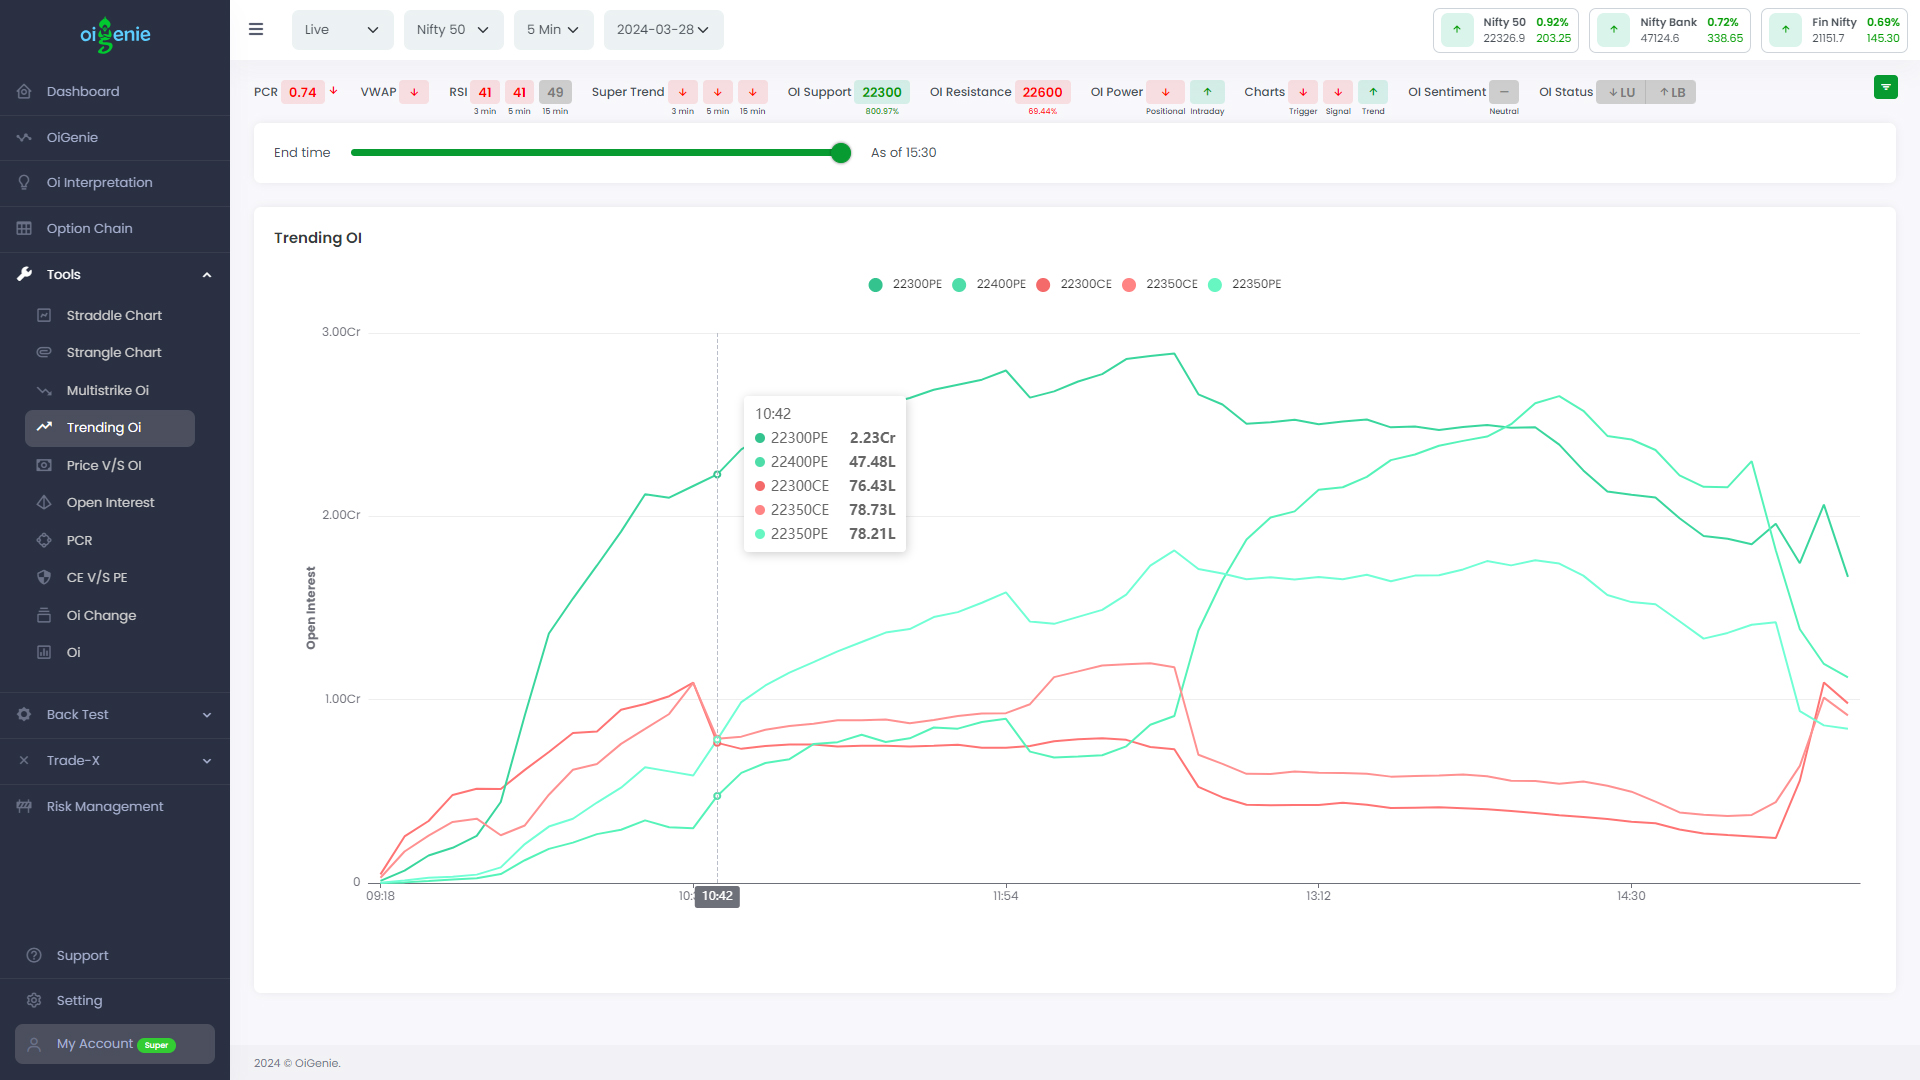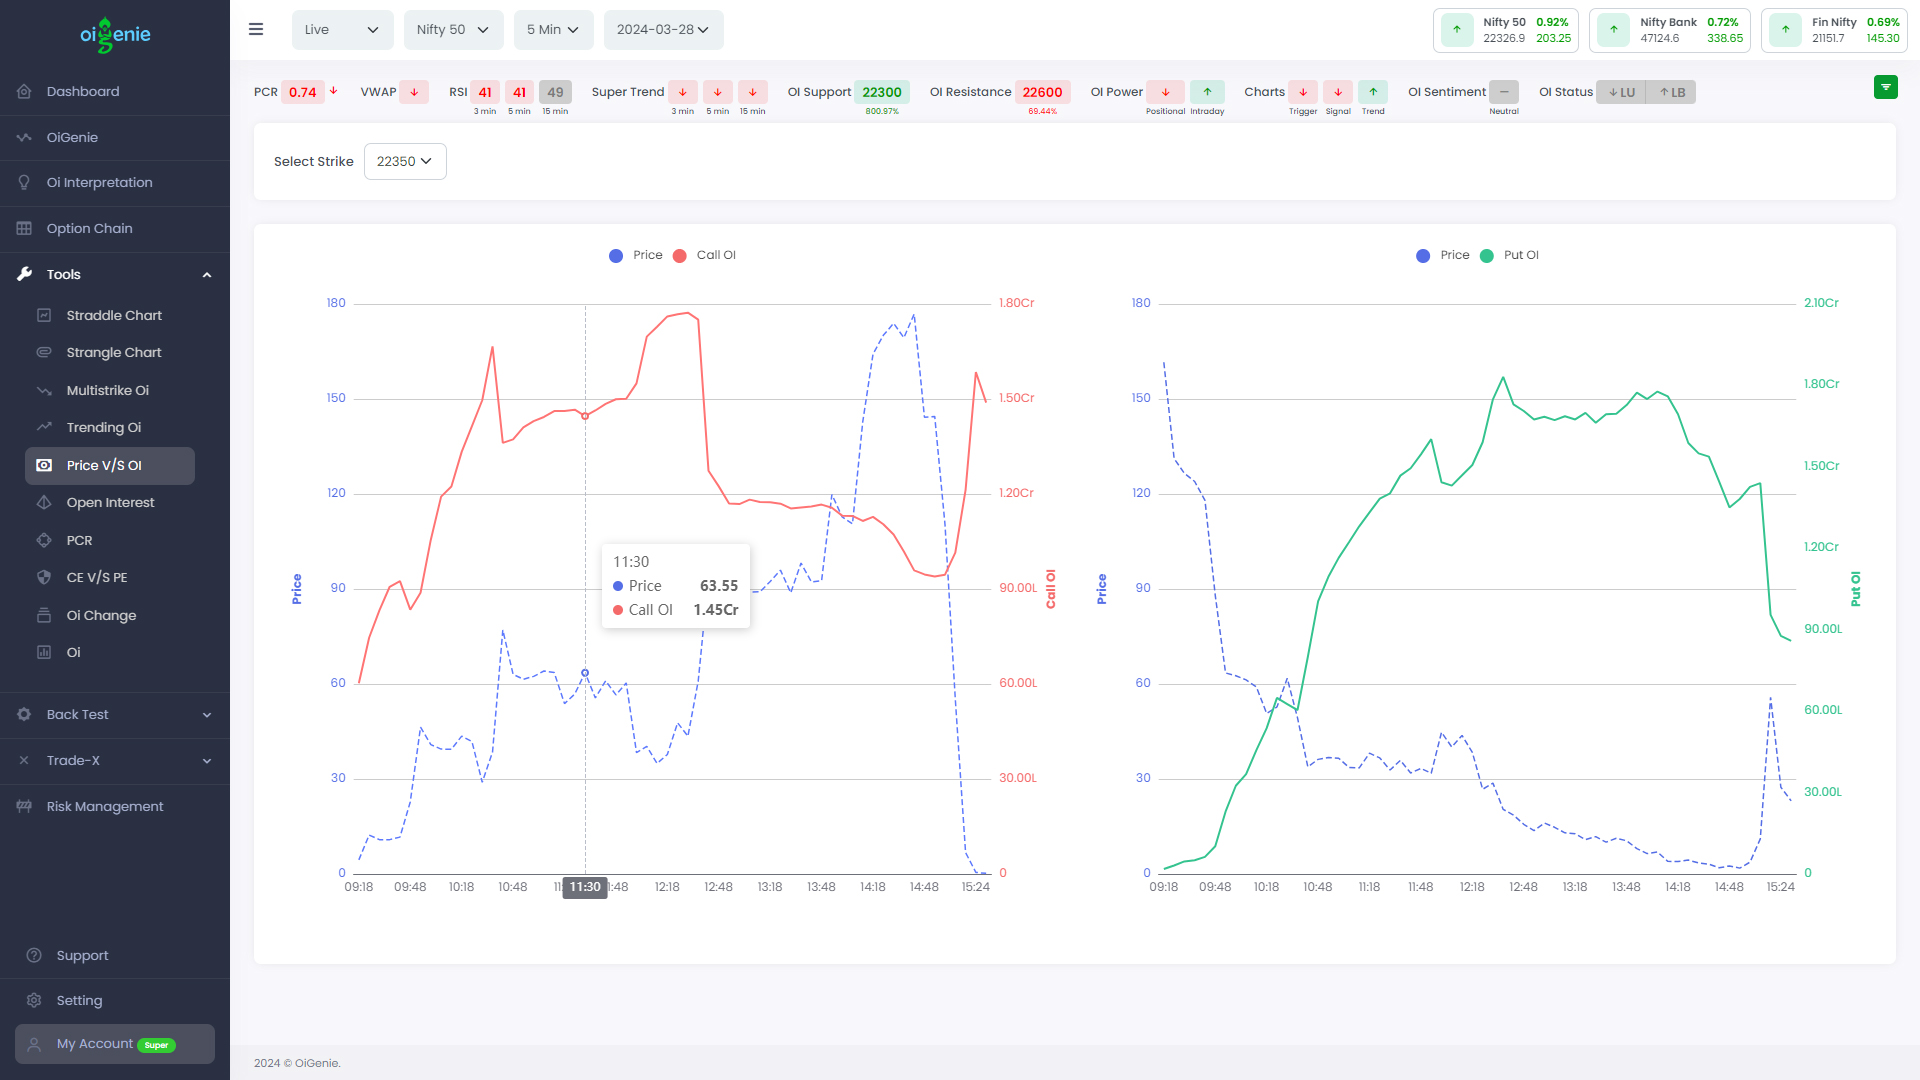
Oi Chart
View the Call Oi and Put Oi alongside the
asset's price in a chart format for a clear visual representation of
market trends. This comparison can help identify whether bullish or
bearish sentiment predominates and forecast potential market
movements.
A sudden decrease in Call Oi combined with
an rise in Put Oi signals a market reversal towards bullishness.
Conversely, a sudden increase in Call Oi and a decrease in Put Oi
indicate a market reversal towards bearishness.