OiGenie
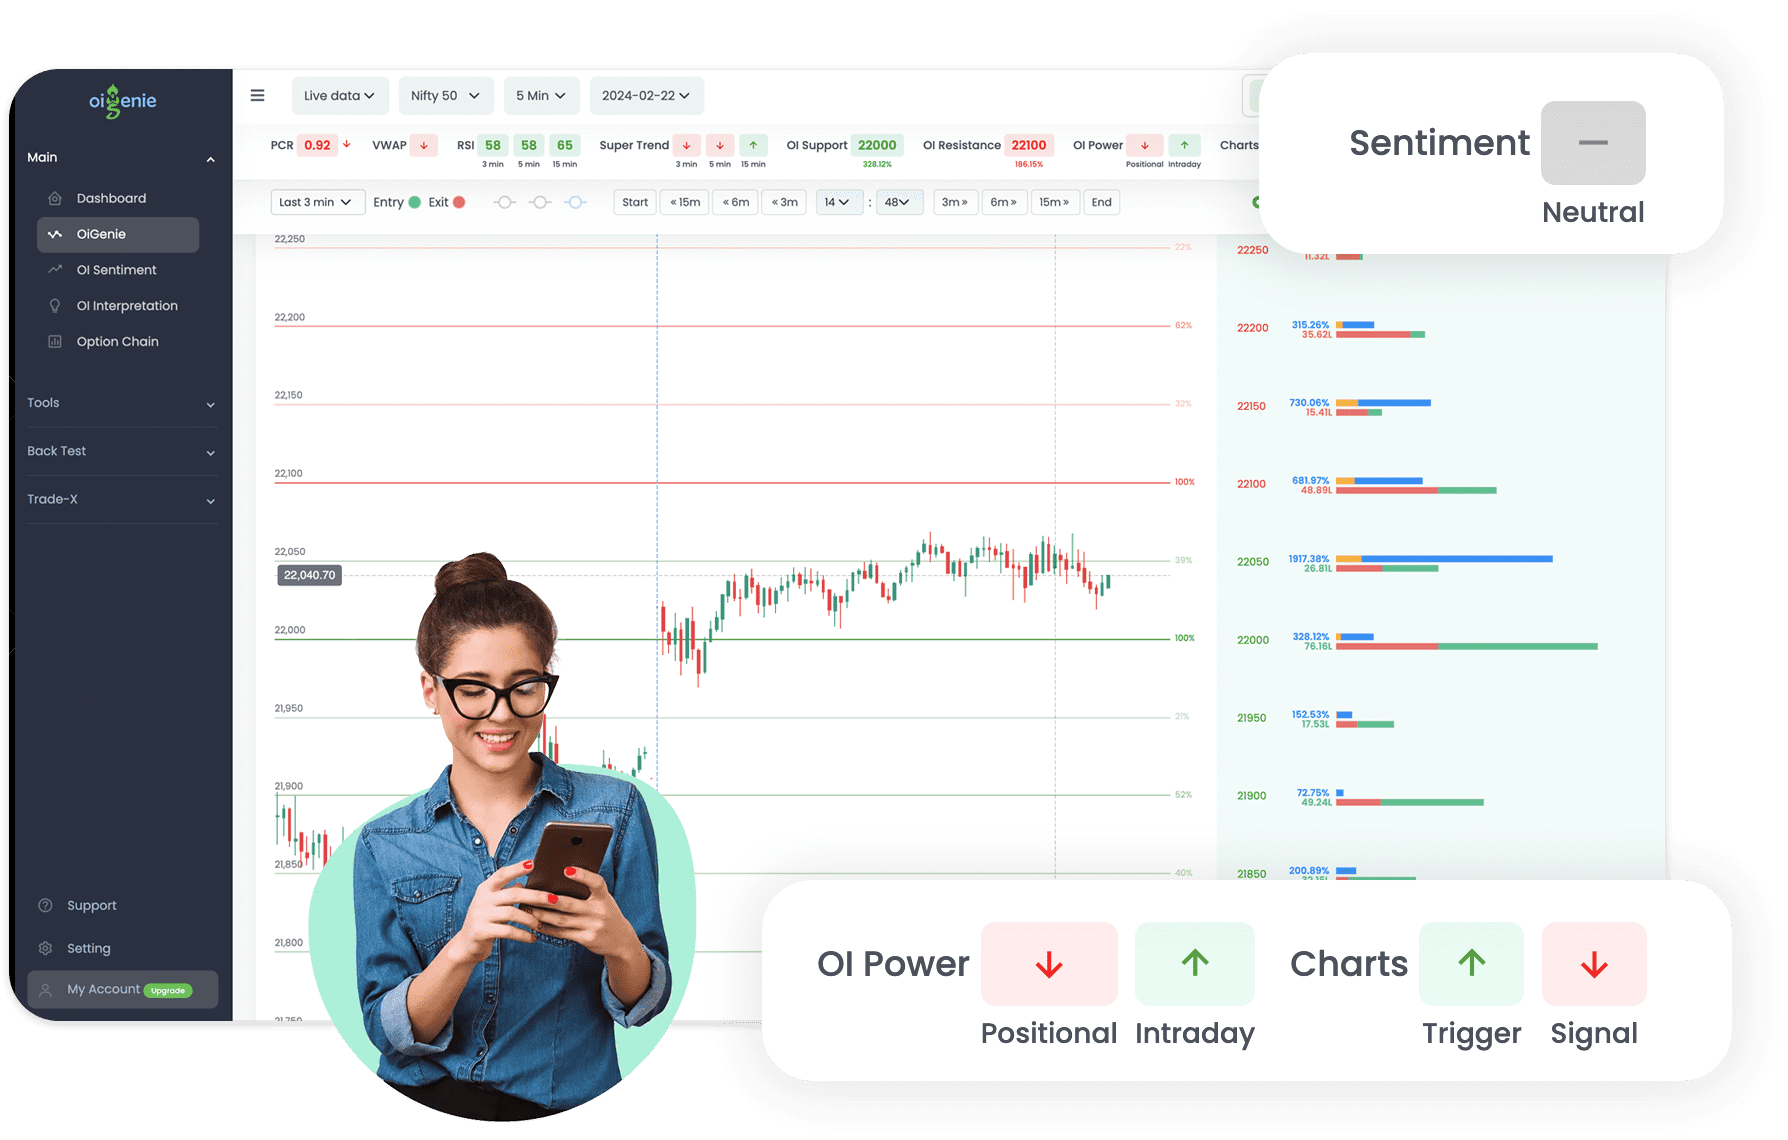
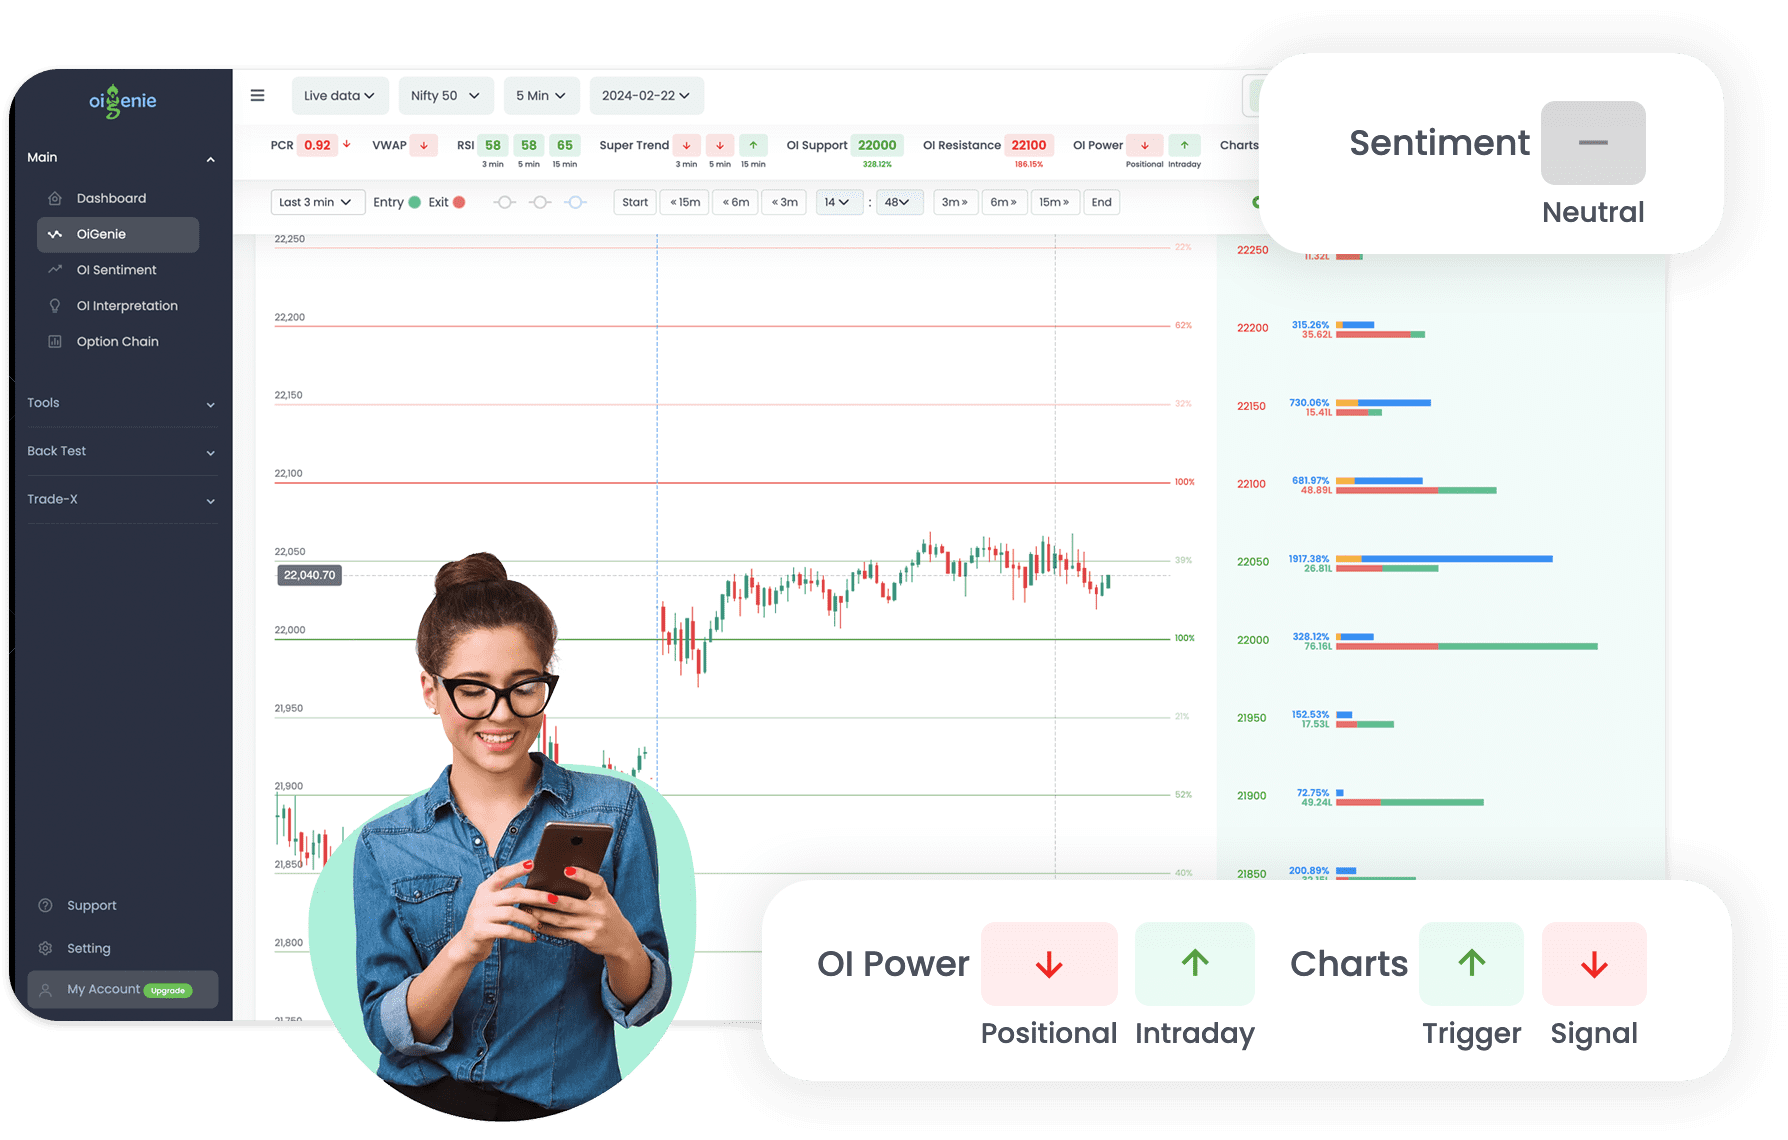
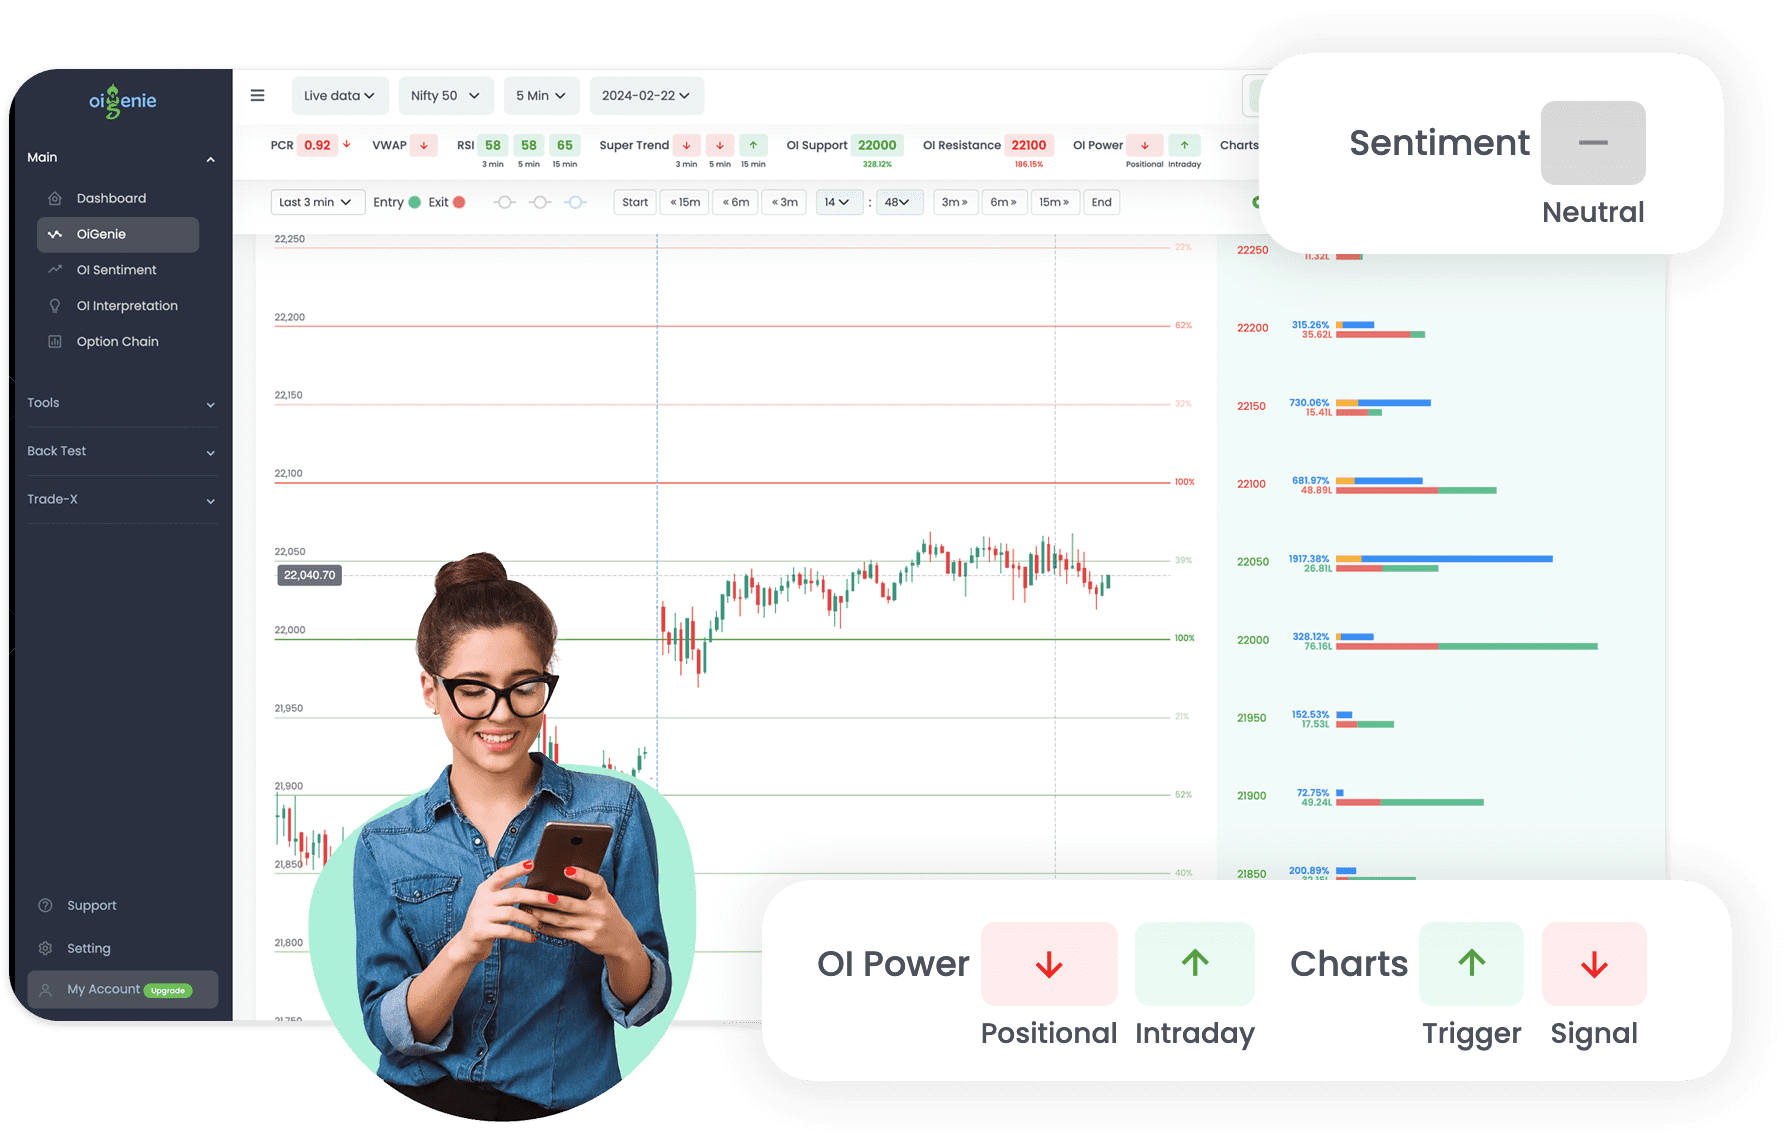
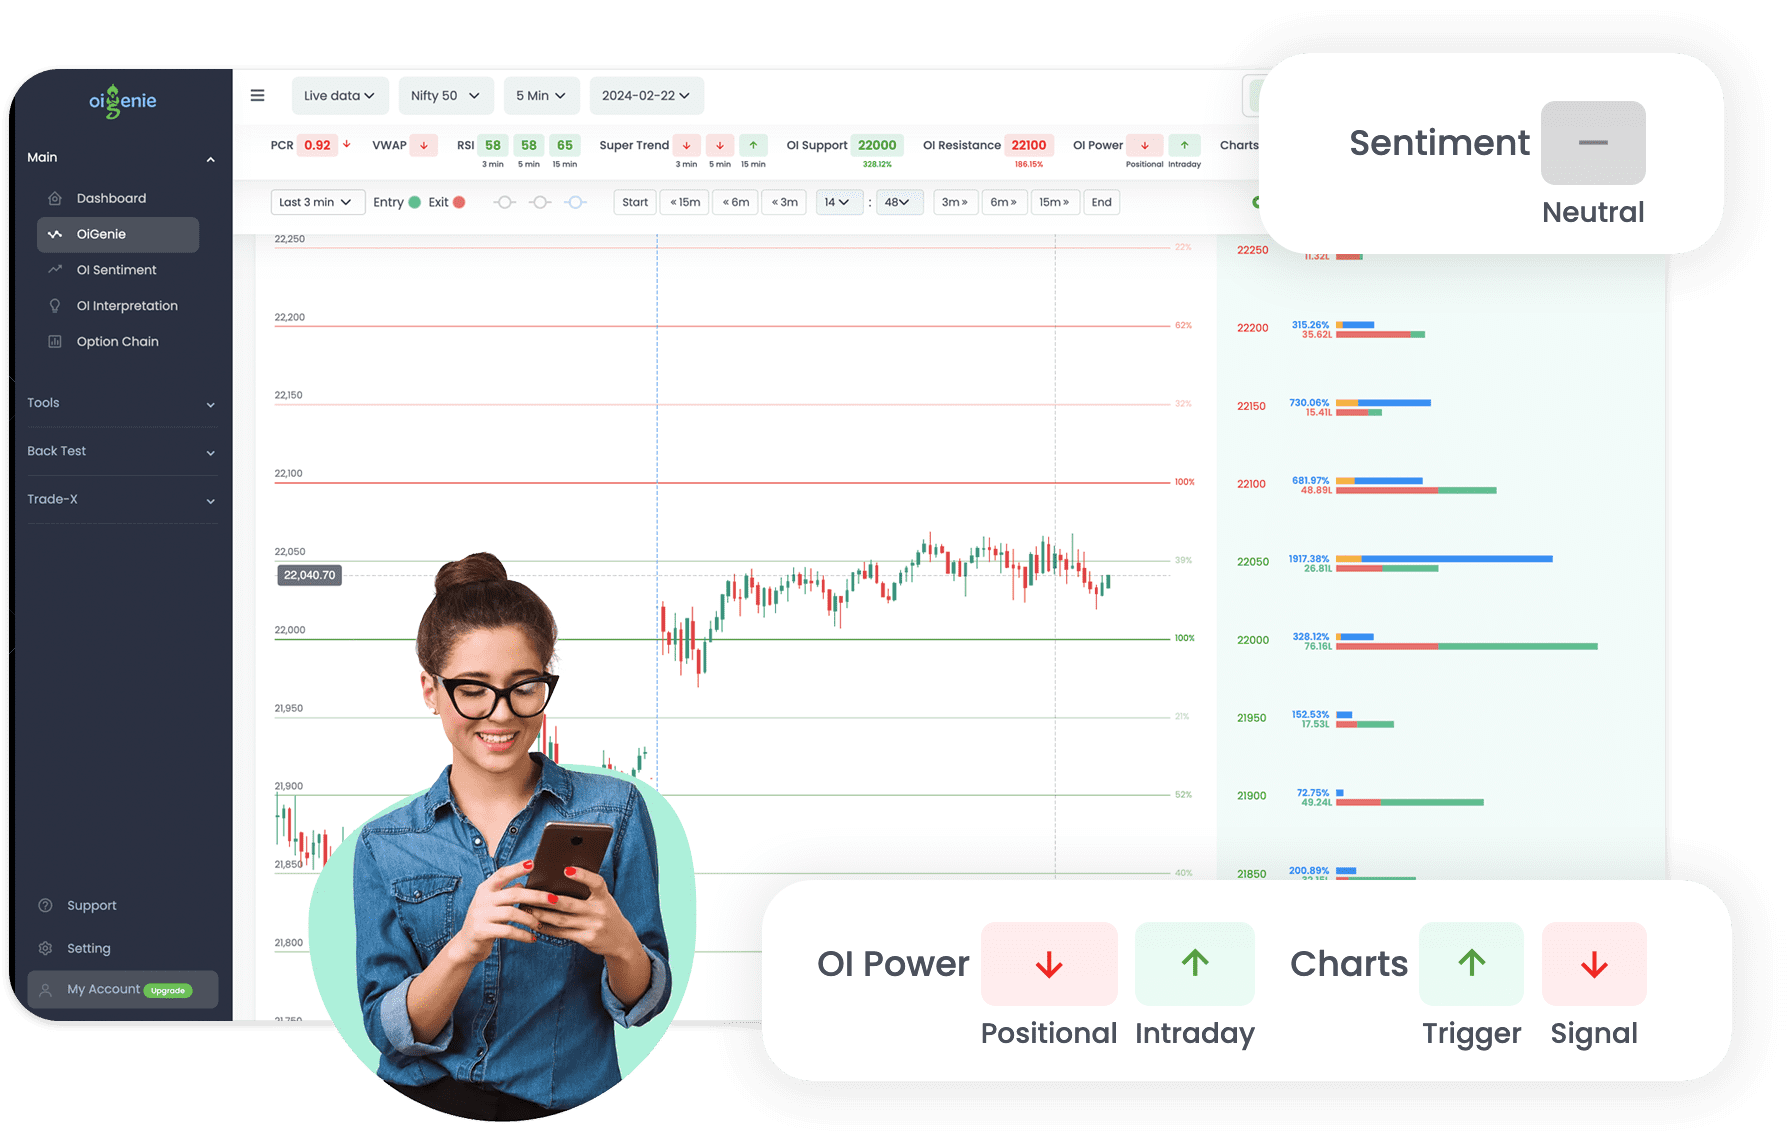
PCR
The Put-Call Ratio (PCR) is used to
measure the overall sentiment of the market. It is calculated by
dividing the total number of traded put options.
(Put Oi) by the total number of traded
call options (Call Oi).
PCR > 1: Indicates a bearish sentiment,
with more puts traded, suggesting expectations of a market decline.
PCR < 1: Shows a bullish sentiment, with
more calls traded, implying an anticipated market rise.
Rising PCR: A rising PCR suggests bullishness in the market.
Declining PCR: A declining PCR suggests bullishness in the market.
Declining PCR: A declining PCR suggests bullishness in the market.
PCR should be used alongside other
indicators for a comprehensive market analysis.
VWAP
Volume Weighted Average Price (VWAP) is
used to determine the average price of an asset throughout the day,
based on both volume and price. It is often used as a trading
indicator to decide whether a security is being traded at a fair
value.
Price above VWAP: Indicates bullishness
Price below VWAP: Suggests bearishness
Price below VWAP: Suggests bearishness
Key Uses:
Trade Entry: Buy when the price is below
VWAP and appears to rise and sell when above VWAP and seems to fall.
Support/Resistance: VWAP can act as a
support or resistance level during the day
RSI
RSI values can help identify potential
reversal points in the market when an asset moves from overbought to
oversold territories or vice versa.
Below 20: Indicates an oversold
condition, suggesting a potential buying opportunity.
Above 80: Signals an overbought condition, indicating a
possible selling point.
Between 45 and 55: Considered neutral, with no strong buy or
sell signals.
Note: This values might differ as per your
trading style.
Observing RSI values across multiple
timeframes, such as 3 minutes, 5 minutes, and 15 minutes,
allows traders to determine overbought and oversold conditions for
both short-term and long-term durations. This multi-timeframe
analysis can provide a better understanding of the market's momentum
and potential trend changes, enabling more informed trading
decisions.
Super-trend
They say "Trend is your Friend".
SuperTrend is a trend-following indicator
that combines volatility and price movements to determine the
direction of the trend. It provides buy and sell signals based on
the positioning of the price in relation to the SuperTrend line.
Price above SuperTrend line: Indicates a
bullish trend, suggesting a potential buying opportunity.
Price below SuperTrend line: Signals a
bearish trend, indicating a possible selling point.
Trend changes: Occur when the price
crosses the SuperTrend line, pointing to potential reversal points.
Observing super-trend across multiple
timeframes, such as 3 minutes, 5 minutes, and 15 minutes, allows
traders to determine the trend for both short-term and long-term
durations. This multi-timeframe analysis can provide a better
understanding of the market's momentum and potential trend changes,
enabling more informed trading decisions.
Oi Support
It is a support level at which high put
options acting as price support. It suggests potential buying
interest and upward price movements as traders defend positions or
enter new long positions near this level.
Oi Resistance
It is a resistance level at which high
call options acting as price resistance. It suggests potential
selling interest and upward price movements as traders defend
positions or enter new short positions near this level.
Oi Power
This helps traders determine the market
mood and movement by analyzing the dominance of traders (intraday
and positional) by calculating open interest (OI) and its percentage
change.
Bullish Signal: When both intraday and
positional metrics display a bullish (green) indication, it suggests
a strong bullish market trend.
Bearish Signal: If both intraday and
positional indicators show a bearish (red) sign, it points to a
potential bearish market movement.
Ranging/Sideways Market: When intraday and
positional data present opposite signs (one bullish, one bearish),
it typically indicates a market without a clear direction, often
moving sideways.
Charts
3 moving averages (EMA) to determine the
short term and long term trend. You can change the parameters to fit
your specific trading strategy and risk tolerance.
Bullish Signal: When these EMAs align
(short above medium above long), it suggests a bullish trend.
Bearish Signal: When these EMAs align
(short below medium below long), it suggests a bearish trend.
Trend Reversal: Crossovers between these
EMAs can signal potential trend reversals.
Oi Sentiment
We evaluate open interest changes and
trading volume at key price levels to determine the strength and
direction of market sentiment.
This helps traders understand the market
sentiment as : Mild Bullish, Extremely Bullish, Neutral, Mild
Bearish, and Extremely Bearish.
Oi Status
Short Covering: When option sellers (who
are short on options, expecting the market to decline) start buying
back their positions to close them, it can indeed be interpreted as
a bullish signal.
Long Unwinding: When option sellers (who
are long on options, expecting the market to decline) start selling
back their positions to close them, it can indeed be interpreted as
a bearish signal.
Short Buildup: When traders create new
short position, it is interpreted as a bearish signal.
Long Unwinding: When traders create new
long position, it is interpreted as a bullish signal.
Look Who is entering and Who is
Determine the market movement by observing
the entry and exit patterns of traders.
Bullish Sign: When bullish traders are
entering into the market by creating new long positions and bearish
traders are exiting from the market by closing their positions.
Bearish Sign: When bearish traders are
entering into the market by creating new short positions and bullish
traders are exiting from the market by closing their positions.
This analysis helps in understanding the
overall market sentiment and potential direction of price movements.
The Time Machine
Review the options chain at previous time
stamps at specific points in the past. Essentially, going backward
to review the options chain at previous timestamps provides valuable
context for making more informed trading decisions by seeing the
history of market behavior.
This retrospective analysis helps traders
to:
Understand Sentiment: Changes in open
interest, change in Oi percentage and volume over time can indicate
whether traders were bullish or bearish during specific periods.
Backtesting the options chain: Traders can
assess how their strategies would have performed under historical
market conditions.
Oi Bars
This easiest approach to analyze the
options chain simplifies the process by graphically representing
open interest (Oi) and its percentage change, alongside numerical
data.
This method allows traders to easily
identify key levels of support, resistance, and potential points of
trend reversal by visually interpreting the changes in market
sentiment reflected through Oi metrics.
The subtle background color (red and
green) indicates the dominance of the traders as bearish or bullish.
You can also compare the Oi data at previous timestamps.
Support Resistance Strength
Determine the strength of the level where
it will act as support or resistance by observing the levels (0 to
100). 100 indicates high strength.
If you see the price in between 2
immediate strong support and strong resistance area, the market can
be interpreted as range bound or sideways, unless it breaks out the
level with high volume and significant reversal in Oi data.
Assess the strength of potential support
or resistance levels by examining their weightage on a scale from 0
to 100, with 100 representing maximum strength. When the price is
positioned between two areas of strong support and resistance, it
suggests the market is moving within a range or sideways. This
sideways behavior continues until there's a breakout, with high
trading volume and a significant change in open interest data,
signifying a shift in market trend.
When the price hits those significant
support or resistance level without any accompanying change in open
interest, it typically suggests the price is likely to be rejected
at that point.
Historical Backtesting of Option Chain
Available from 16th Jan 2024
Backtest the data and create your own
trading confluence.
Still confused where the market would go?
OiGenie verdict (Powered by Ai)
OiGenie verdict (Powered by Ai)
Red = Market may go down
Green = Market may go up
Green = Market may go up
With these two clear color indications, we
have formatted all the data (technical and option chain) in a way
that allows you to read and interpret it simply by identifying the
colors.
Genie is powered by AI that combines all
this data, providing insights on market direction, momentum, and
other possibilities.
Disclaimer
Option trading involves significant risk
and high volatility, with around 90% of traders facing losses.
Invest the amount what you can afford to lose without harming your
financial health or mental well-being. Avoid becoming addicted to
trading and don’t overtrade. Wise investing and self-discipline are
crucial to make profit.
Genie's verdict is not always 100%
accurate. Use stop loss and adhere to risk management practices.
Combine it with other confluences for decision-making. Remember,
it's your money; you need to protect it.
No more losses!
Select the right strike price.
Select the right strike price.
Whether you are an option buyer or option seller, OiGenie suggests the most appropriate strike prices during
various trading days and sessions. This is a common reason option
traders make losses, as they tend to choose strike prices without
knowing the associated risks.
OiGenie aims to increase the profit while
significantly reducing the risk of investing in futures and options.
This assistance helps to achieve a balance between risk and
potential returns is key to long-term success.